Targeted Buyer Outreach
Direct outreach and source-stamped digital exposure will focus on buyer groups most likely to pursue the property.




Prepared Exclusively for the Matthew E Meyer Trust
August 2026
Published team performance, laaa.com/track-record, as of August 28, 2026.
Of those closings, 341 are apartment sales covering 4,688 units. CoStar ranked LAAA the most active multifamily team in Los Angeles County from 2019 through 2021, and the team has not finished a quarter without a closed sale since it was founded.
Volume matters here for one reason: it is where the buyer list comes from. The buyer for this property is far more likely to be someone this team has already closed with than someone who finds it on a portal, and a team that closes every quarter is calling those people about something regardless.
• Chairman's Club - Marcus & Millichap's top-tier annual honor
• National Achievement Award - multiple years, both partners
• #1 Most Active Multifamily Team in LA County - CoStar 2019-2021
• Sales Recognition Award - every year since 2016
• 493 closed transactions - $1.55B in sales volume
Our public, continuously maintained reach combines active email subscribers, owner and investor contacts, a building-owner database, and targeted direct buyer calls for each listing.
Direct outreach and source-stamped digital exposure will focus on buyer groups most likely to pursue the property.
Named calls into the local buyer pool, the 1031 exchange buyers who have traded in this size class, and the private capital already holding product in the submarket.
National listing distribution, the firm's investor database, and coordination with MMCC on debt terms so a buyer arrives pre-qualified rather than exploring.
A property-specific offering site, targeted email, and syndication to the platforms buyers in this market actually search.
Most brokers are reactive. They post the listing, run an email blast, and wait for the phone to ring. We do all of that, and we do it well. Then we do the part almost nobody does. We pick up the phone.
Before your building goes to market, our system builds a probable buyer list for it specifically. It pulls the county assessment record for every property in the surrounding area: who owns it, where their mail goes, what they paid, when they bought, who financed it, and how many other buildings they hold. Out of that come the three groups most likely to buy your building: owners of comparable product nearby, buyers who have closed on buildings like yours recently, and exchange buyers with money that has to be placed on a deadline.
That list runs well over 100 names, and we call every one of them.
A four unit building finances as residential rather than commercial. A buyer qualifies on personal income with roughly 75% of the rents credited, and the property is not underwritten to a debt service coverage test. That single fact governs who bids and what they pay. Owner users compete directly with investors, and small San Pedro fourplexes consequently clear at going in yields well below what a commercial multifamily buyer would accept.
It also shapes the comparable evidence. One of the four recorded sales in this set went to an owner occupant at $320,000 per unit, the highest price per unit in the set, following a purchase earlier the same year at $532,000. That is a different buyer with a different arithmetic, and this opinion weights it accordingly.
The building will be marketed to two distinct groups, and the material differs for each. An owner user cares about the vacant unit path, the condition of the two turned units, and the monthly carry after financing. A private investor cares about the loss to lease, the cost and probability of a buyout, and the deferred maintenance schedule.
For both, the honest position is that this is a well located, structurally sound vintage fourplex with a large and genuine rent gap that is expensive and uncertain to capture. Presenting it as a straightforward value add would not survive the first conversation about the Rent Stabilization Ordinance. Presenting it as what it is, with the buyout arithmetic in the buyer's hands, reaches the buyer actually equipped to execute.
Buys with residential financing, occupies one unit, and treats the other three as carry. Values the completed seismic work and the garages, and is the least sensitive to cap rate of the three. This is the buyer who paid $320,000 per unit two blocks west.
Owns two to ten small buildings in the harbor area, self manages, and underwrites without a management fee. Prices deferred maintenance carefully and will discount for the original windows and the electrical work.
Underwrites the two long held units at market and accepts that turnover may take years. Pays for the optionality rather than for a contracted path, and is the buyer most likely to move if a buyout is signed before or during escrow.
Anchor the campaign in verified current operations and supported market evidence.
233-239 S Grand Avenue is a four unit building of 1927 vintage on the east side of Grand, four blocks from the harbor and a short walk from downtown San Pedro. The improvements run 1,848 square feet across four one bedroom units averaging 462 square feet, with four detached garages behind. The ownership pays water and sewer. Tenants carry their own gas and electricity.
The building's economics are defined by two tenancies. Units 233 and 237 turned in 2023 and rent for $1,568 and $1,512. Units 235 and 239 have been occupied since 2011 and rent for $834 each. A remodeled one bedroom three blocks away leased at $1,800 in January, so the two long held units sit at roughly 46% of what the same product achieves today. That gap is the whole of the value question here, and because both units are covered by the Rent Stabilization Ordinance it cannot be closed by raising rent.
This opinion answers the two questions the ownership asked. What is the property worth as it stands, and what is it worth with units 235 and 239 delivered vacant. The Buyout Scenarios section then sets out the arithmetic connecting the two, with every assumption adjustable.
The building will be marketed to two distinct groups, and the material differs for each. An owner user cares about the vacant unit path, the condition of the two turned units, and the monthly carry after financing. A private investor cares about the loss to lease, the cost and probability of a buyout, and the deferred maintenance schedule.
For both, the honest position is that this is a well located, structurally sound vintage fourplex with a large and genuine rent gap that is expensive and uncertain to capture. Presenting it as a straightforward value add would not survive the first conversation about the Rent Stabilization Ordinance. Presenting it as what it is, with the buyout arithmetic in the buyer's hands, reaches the buyer actually equipped to execute.
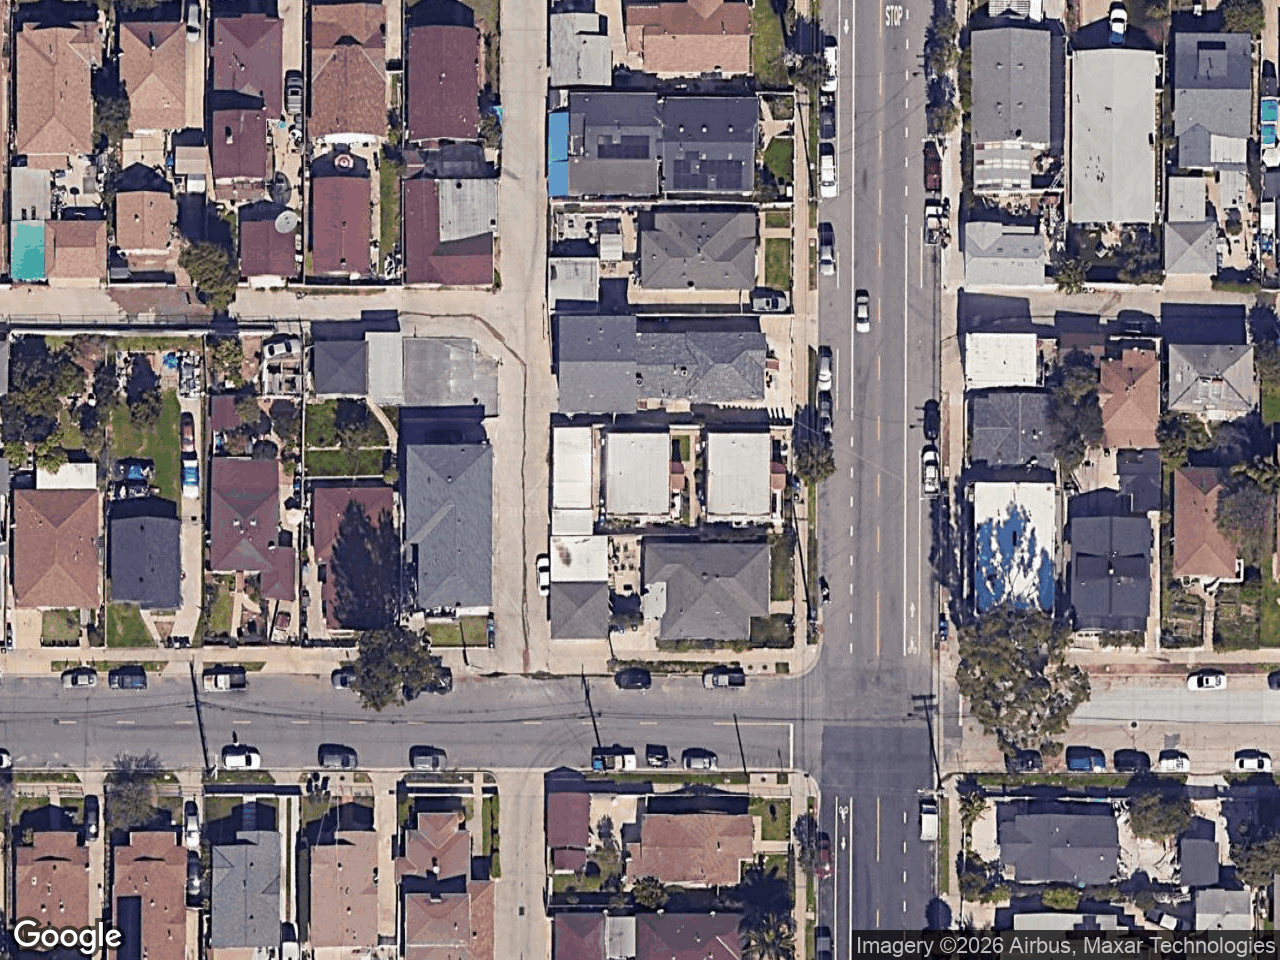
San Pedro sits at the southern end of Los Angeles, wrapped around the Port of Los Angeles and reached by the 110 Freeway. The 90731 zip carries a population near 62,000, a median household income of $76,395 and a median gross rent of $1,740. Renters occupy 67.4% of households, above the 64.0% figure for the City of Los Angeles and the 54.1% figure for the County.
The subject sits within walking distance of the 6th Street and 7th Street corridors and the waterfront redevelopment at the foot of the hill. Small vintage income property dominates the immediate blocks, which is what makes the comparable set for a building of this size and age unusually tight.
| Property & Location Details | |
|---|---|
| Address | 233-239 S Grand Ave |
| City | San Pedro, CA 90731 |
| APN | 7451-016-028 |
| Year Built | 1927 |
| Building SF | 1,848 |
| Lot Size | 4,497 SF (0.1032 ac) |
| Units | 4 |
| Parking | Four detached garages |

| Property Overview | |
|---|---|
| Units | 4 |
| Year Built | 1927 |
| Building SF | 1,848 |
| Lot SF | 4,497 |
| APN | 7451-016-028 |
| Unit Mix | |
|---|---|
| 4x 1 Bed / 1 Bath | 462 (est.) SF |
The improvements comprise two structures totalling 1,848 square feet, arranged as four one bedroom, one bathroom units of roughly 462 square feet each, with four detached garages at the rear. Construction is wood frame on a raised foundation, built in 1927. The parcel runs 4,497 square feet and is zoned R2-1XL within a Community Plan Implementation Overlay.
The seismic work is complete and on the record. LADBS shows sill plate anchor bolts and cripple wall bracing to City Standard Plan 1 under Chapter 92, together with replacement of 30 damaged pier pads and posts, all finaled on 11 April 2024. The ownership reports the cost at $34,000. One clarification matters for how that work is valued. The building is not enrolled in the Chapter 93 mandatory soft story program, which applies to multi storey buildings with tuck under parking rather than to single storey wood frame construction of this type. The work performed is real, permitted and finaled, and it removes a genuine cost from a buyer's plan. It is not a soft story retrofit, and comparable San Pedro buildings of this size do not carry a soft story obligation that this property has discharged.
The ownership describes the building as undermaintained with significant deferred maintenance. Exterior stucco and paint are due, the original windows remain throughout and need replacement, and electrical work is required. A sewer scope and a termite inspection are recommended and have not been performed. Those items are priced into the opinion of value rather than carried as an operating expense.
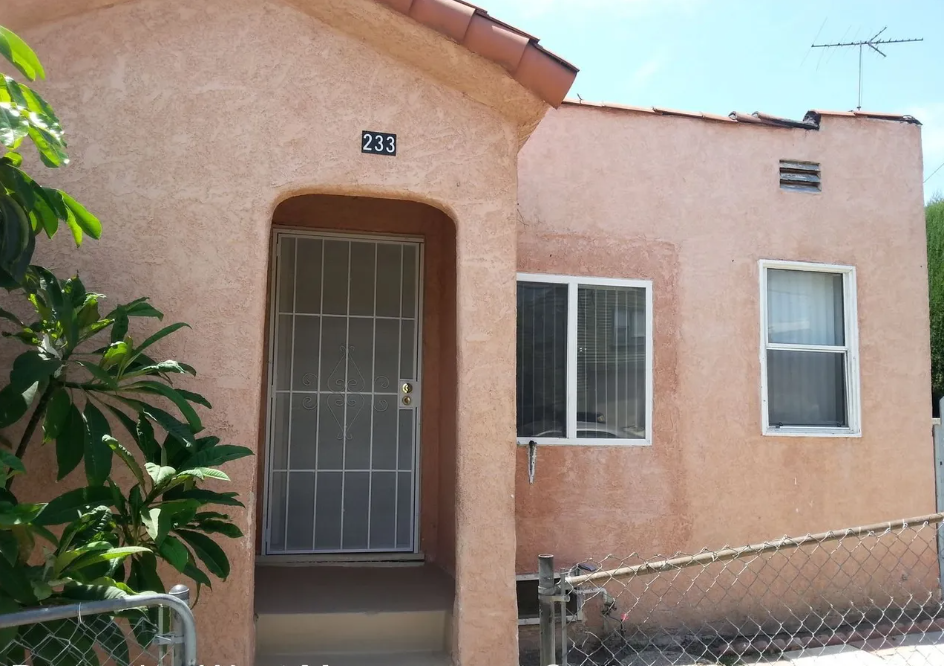
Click any image to enlarge. Images depict the property and representative interiors. Source: listing media and site photography.

| Address | Unit Type | SF | Asking Rent | Distance |
|---|---|---|---|---|
| 1666 W 7th St, San Pedro | 1 Bed / 1 Bath | 528 | $1,800 | 0.27 mi |
| 2339 N Grand Ave, San Pedro | 1 Bed / 1 Bath | 378 (est.) | $2,000 | 0.28 mi |
| 3860 W 5th St, San Pedro | 1 Bed / 1 Bath | 510 (est.) | $1,825 | 0.31 mi |
| 4106 S Pacific Ave, San Pedro | 1 Bed / 1 Bath | 500 (est.) | $1,650 | 0.18 mi |
| Average (4 rent comps) | 479 (incl. est.) | $1,819 | 0.26 mi | |
Four one bedroom comparables were reviewed, all within a third of a mile. The anchor is a signed lease rather than an asking rent. A remodeled one bedroom of 528 square feet at 666 W 7th Street listed at $1,600 and leased at $1,800 in 13 days, at 112.5% of asking. Two size matched observations at 510 and 500 square feet sit at $1,825 and $1,650, and a 378 square foot unit asks $2,000.
The set supports two different numbers for the same building. A renovated unit at this location achieves $1,800. A unit in the subject's current condition, with original windows and dated finishes, achieves $1,600. That distinction runs through the whole of this opinion. The units are not below market because of their size, they are below market because two of them have not turned in fifteen years and none has been renovated.

| Address | Yr | Units | Bldg SF | Sale Price | $/Unit | $/SF | GRM | Cap | Date |
|---|---|---|---|---|---|---|---|---|---|
| 1359 W Amar St, San Pedro | 1918 | 4 | 1,597 | $650,000 | $162,500 | $407 | 9.11 | - | 2025-12-24 |
| 2226 N Western Ave, San Pedro | 1964 | 4 | 3,288 | $866,000 | $216,500 | $263 | 11.72 | - | 2026-01-12 |
| 31025 W 12th St, San Pedro | 1924 | 4 | 2,760 | $1,150,000 | $287,500 | $417 | 12.37 | - | 2026-02-27 |
| 41260 W 9th St, San Pedro | 1928 | 4 | 3,666 | $1,280,000 | $320,000 | $349 | 12.49 | - | 2025-11-14 |
| Median (4 comps) | 3,024 | $1,008,000 | $252,000 | $378 | 12.04 | - | - | ||
A four unit building finances as residential rather than commercial. A buyer qualifies on personal income with roughly 75% of the rents credited, and the property is not underwritten to a debt service coverage test. That single fact governs who bids and what they pay. Owner users compete directly with investors, and small San Pedro fourplexes consequently clear at going in yields well below what a commercial multifamily buyer would accept.
It also shapes the comparable evidence. One of the four recorded sales in this set went to an owner occupant at $320,000 per unit, the highest price per unit in the set, following a purchase earlier the same year at $532,000. That is a different buyer with a different arithmetic, and this opinion weights it accordingly.
1. 359 W Amar St, San Pedro - Heaviest weight. On unit size, vintage and lot it is the only true match in the set, and its listing history is direct evidence of what this product clears. Four units averaging 399 square feet, the only comparable in the set close to the subject on unit size.; Built 1918, nine years older.; Smallest lot of the four. In place rent of $71,340 including one unit vacant at market, 25% above the subject's $56,976.; Listed at $800,000, cancelled, then sold at $650,000.
2. 226 N Western Ave, San Pedro - Supports the upper bound on price per unit but its units are nearly twice the subject's size, so its price per square foot of $263 reads low against this building and is not transferable. Units average 822 square feet, close to double the subject.; Built 1964, thirty-seven years newer, and outside the subject's tax rate area. In place rent of $73,872, 30% above the subject.; Sold in 57 days on market.
3. 1025 W 12th St, San Pedro - Sets the ceiling on price per square foot at $417. Its rents were already at market, so it carries none of the subject's loss to lease. Units average 690 square feet, half again the subject.; Similar 1924 vintage.; Two separate buildings on the parcel. In place rent of $93,000, 63% above the subject, and effectively at market.; Sold out of an institutional single family rental entity whose own basis was a $541,000 acquisition out of REO.
4. 1260 W 9th St, San Pedro - Lightest weight and the reason is on the record. It is the highest price per unit in the set at $320,000 and it is the least transferable: different product, different buyer, and a same year resale at roughly 2.4 times the prior price. Units average 916 square feet, twice the subject.; Largest building and lot in the set. In place rent of $102,480, 80% above the subject.; County record shows a prior sale of $532,000 earlier in the same year and the buyer is owner occupant, so this is a renovate and resell inside twelve months to an owner user rather than an arm's length investor trade.
| Basis | Price | $/Unit | $/SF | GRM Current | GRM Pro Forma |
|---|---|---|---|---|---|
| Suggested list price | $775,000 | $193,750 | $419.37 | 13.60 | 9.50 |
| Range top | $750,000 | $187,500 | $405.84 | 13.16 | 9.19 |
| Midpoint | $715,000 | $178,750 | $386.90 | 12.55 | 8.76 |
| Range bottom | $680,000 | $170,000 | $367.97 | 11.93 | 8.33 |
| Units | Type | Approx SF | Current Rent | Current Monthly | Market Rent | Market Monthly |
|---|---|---|---|---|---|---|
| 4 | 1 Bed / 1 Bath | 462 (est.) | $1,187 | $4,748 | $1,700 | $6,800 |
| Total Scheduled Rent | $1,187 | $4,748 | $1,700 | $6,800 | ||
| Additional Income[1] | - | $0 | - | $0 | ||
| Monthly Scheduled Gross Income | - | $4,748 | - | $6,800 | ||
| Current | Market | |
|---|---|---|
| Scheduled Gross Income[2] | $56,976 | $81,600 |
| Vacancy Reserve at 1.1% | ($654) | $0 |
| Gross Operating Income | $56,322 | $81,600 |
| Operating Expenses | ($20,297) | ($20,231) |
| Net Operating Income | $36,025 | $61,369 |
| Current | Pro Forma | |
|---|---|---|
| Admin[3] | $496 | $496 |
| Insurance[4] | $2,244 | $2,244 |
| Landscaping[5] | $720 | $720 |
| Manager[6] | $3,379 | $3,379 |
| Repairs Maintenance[7] | $1,991 | $1,991 |
| Taxes[8] | $8,188 | $8,188 |
| Utilities[9] | $3,279 | $3,279 |
| Underwriting Expense Adjustment[10] | $0 | ($66) |
| Total Operating Expenses | $20,297 | $20,231 |
| Expense Ratio | 36.0% | 24.8% |
| Per Unit | $5,074 | $5,058 |
| Per Square Foot | $10.98 | $10.95 |
[1] Additional Income: Nil. The four detached garages are used by the tenants and generate no separate income, and there is no laundry or parking revenue.
[2] Scheduled Gross Income: Scheduled rent at the rents in place, from the ownership's rent roll. No vacancy factor is applied on a four unit property.
[3] Admin: Underwritten annual estimate, not a seller T12 actual.
[4] Insurance: $200 per unit plus $1.00 per gross square foot, which is $2,648.
[5] Landscaping: The ownership's 2025 actual of $720.
[6] Manager: Underwritten annual estimate, not a seller T12 actual.
[7] Repairs Maintenance: Underwritten annual estimate, not a seller T12 actual.
[8] Taxes: Underwritten annual estimate, not a seller T12 actual.
[9] Utilities: Underwritten annual estimate, not a seller T12 actual.
[10] Underwriting Expense Adjustment: Aggregate difference between classified T12 expense lines and the modeled current and pro forma operating expense totals.
Owner-reported figures are unaudited. A buyer should verify all income and expenses in due diligence.
| Operating Data | |
|---|---|
| Price | $775,000 |
| Number of Units | 4 |
| Price per Unit | $193,750 |
| Price per SF | $419.37 |
| Current GRM | 13.60 |
| Market GRM | 9.50 |
| Acquisition Structure | |
|---|---|
| Structure | All Cash |
| Equity Required | $775,000 |
The property is underwritten on the residential basis that applies to a two to four unit building. Income is actual scheduled rent with no vacancy factor. Expenses carry reassessed property taxes at 1.25% of the recommended price, insurance on the standard formula, owner paid water and sewer, maintenance normalised to $850 per unit, gardening, and the mandatory LAHD registration fee. No management fee and no replacement reserve are carried, because a building of this size is bought and operated by its owner. Operating expenses total $20,231 against scheduled rent of $56,976, a 35.5% expense ratio, and net operating income is $36,745.
Four recorded fourplex sales in San Pedro between November 2025 and February 2026 frame the value. They run from $162,500 to $320,000 per unit and from $263 to $417 per square foot, and that spread is explained almost entirely by unit size. The set runs from 399 to 916 square feet per unit against the subject's 462. Only 359 W Amar Street brackets this building on size and vintage, and it is the most instructive sale in the set for a further reason. It carried in place rent 25% higher than the subject's, it was listed at $800,000, that price was withdrawn, and it sold in December at $650,000.
Applied to the subject, the gross rent multiplier evidence indicates $519,000 to $712,000 with a median near $686,000, and the price per square foot evidence indicates $487,000 to $770,000 with a median near $699,000. Price per unit is not usable here without adjustment, because unit sizes across the set vary by a factor of 2.3. Weighting 359 W Amar most heavily for comparability, crediting the completed seismic work and the four garages, and deducting for the original windows, stucco and electrical work, the opinion of value as the property stands today is $680,000 to $750,000. The recommended asking price is $775,000, which allows a negotiation into the range.
With units 235 and 239 delivered vacant and renovated to the standard the 666 W 7th lease describes, scheduled rent rises to $80,160 and net operating income to roughly $59,900. On the same evidence the opinion of value in that condition is $835,000 to $925,000, and the recommended asking price is $950,000. The spread between the two conditions is what the following section examines.
Supported value range: $680,000 to $750,000
This is a broker opinion of value prepared for the exclusive use of the Matthew E Meyer Trust. It is not an appraisal and was not prepared by a licensed appraiser.
Every income and expense figure originates in the ownership's email of 24 August 2026. No rent roll export, general ledger or tax bill was provided, and a buyer will re-verify these figures during escrow.
Recorded price, transfer date, deed number, unit count, building area and year built for each comparable sale are county record. In place rents for each comparable come from the listing at the time of sale. No cap rate is published for any comparable, because no verified operating statement exists for any of them.
The Buyout Scenarios section presents arithmetic, not a recommendation. Whether to pursue a buyout depends on facts about each household that only the ownership and the tenants know.
Units 235 and 239 have been occupied since 2011 at $834 a month, against a renovated market rent near $1,800 demonstrated by a signed lease three blocks away. Both units are covered by the Rent Stabilization Ordinance, so reaching that rent means a voluntary buyout, a renovation, and a re-lease. This section lays out that arithmetic and lets you move every assumption in it.
What it returns is a ceiling rather than a recommendation: the most that could be paid to a tenant while still earning the profit margin you set. It assumes both units are turned and it does not assume either tenant accepts. Whether to pursue a buyout at all is your decision, and it turns on facts about each household that only you and the tenants know.
The two benchmarks are the City of Los Angeles relocation assistance amounts for no-fault displacement, LAHD Chart A, effective July 1 2026 through June 30 2027, at the tenancy of three or more years column that both households fall into. A qualified household is one where a tenant is 62 or older, disabled, or housing minor dependent children. A voluntary buyout carries no statutory minimum and there is no no-fault path available here, so these are shown as the reference a tenant is likely to weigh an offer against rather than as a floor you are obliged to pay.
| Forgone rent while vacant, three months at $834 | $2,502 |
| Leasing commission, half month at market | $900 |
| Marketing, cleaning and make-ready | $750 |
| Utilities during vacancy | $400 |
| Buyout agreement, LAHD filing and counsel | $2,000 |
| Total per unit | $6,552 |
Renovation and transaction costs are deducted per unit turned, then the profit margin is applied to total spend. The transaction costs below are held constant as the sliders move. Renovation spans a cosmetic turn of kitchen, bath, flooring and paint at the low end through a full turn carrying this unit's share of window replacement at the high end.